What are the pancreatic cancer survival rates in Canada?
Pancreatic cancer survival rates in Canada, explained plainly: the 12% five-year figure, the 2026 cases and deaths, survival by stage and by province, and what the numbers can't tell you.
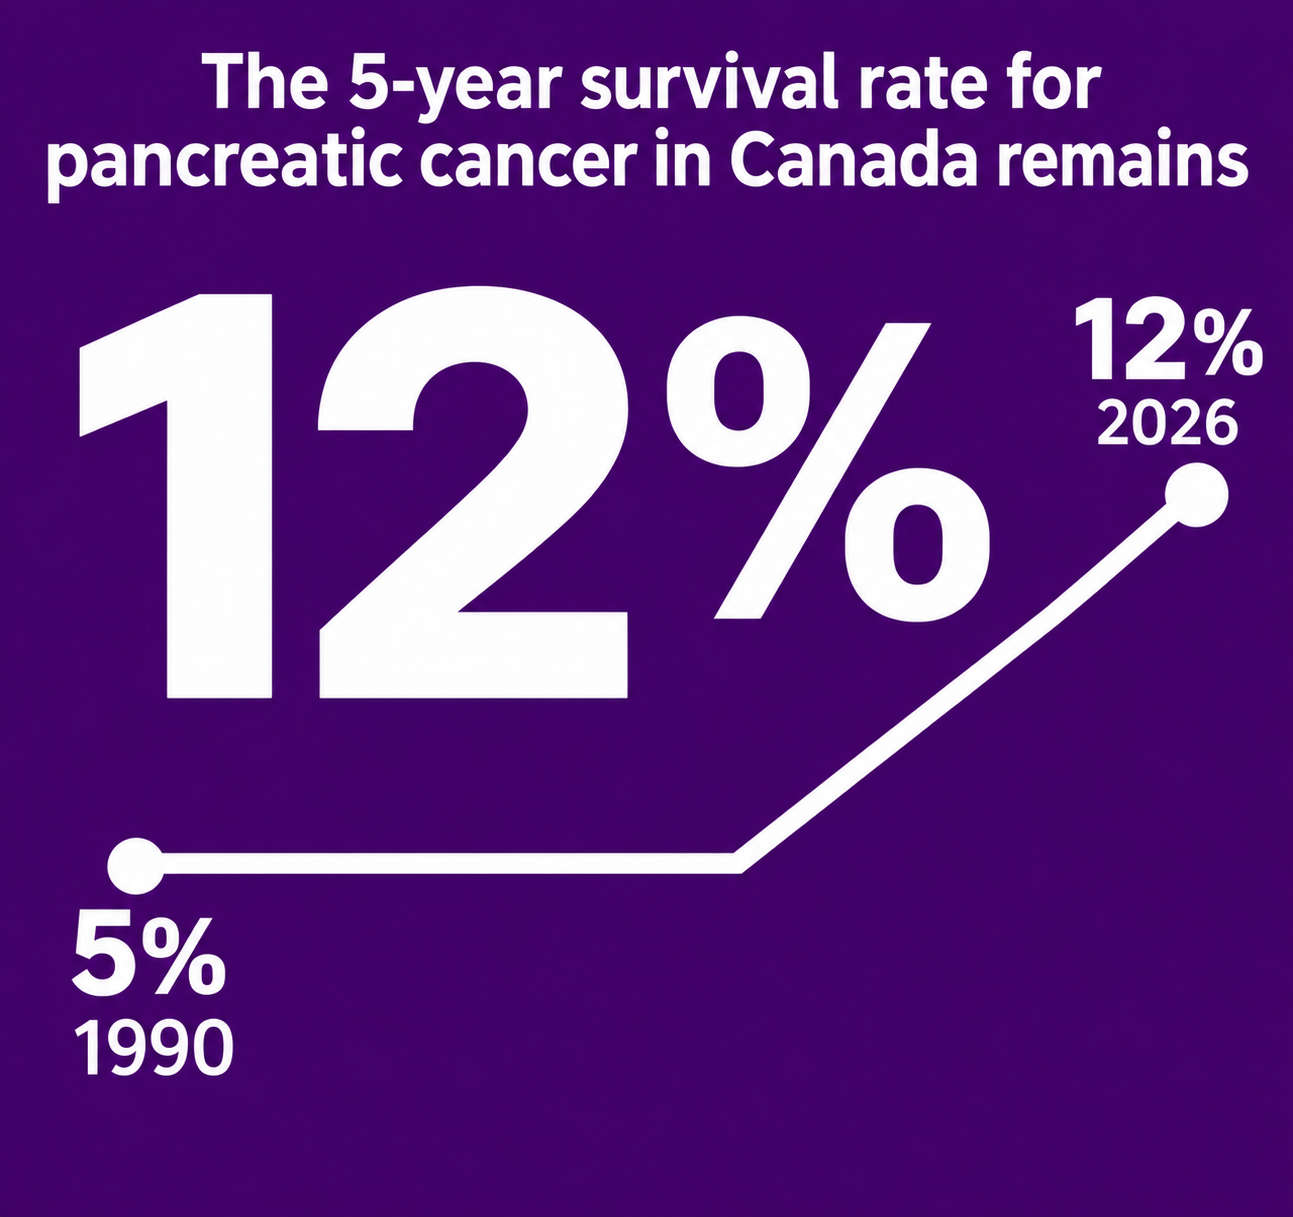
Pancreatic cancer has the lowest survival rate of any common cancer in Canada. That is the hard fact behind every number on this page. We have gathered the most current Canadian figures here — from the Canadian Cancer Society and Statistics Canada — and explained, in plain language, what each one means, where it comes from, and what it cannot tell you.
What do these numbers mean?
A survival rate is a population average. It describes what happened to a large group of people diagnosed in the past — it is not a prediction about any one person, and it is not a deadline.
"12 out of 100 people are alive five years later." That is the plainest way to read the headline figure. Five-year net survival estimates the percentage of people who would survive their cancer if cancer were the only possible cause of death. It is the measure Statistics Canada and the Canadian Cancer Society use to compare cancers and track progress over time, because it removes deaths from other causes that have nothing to do with the cancer.
Why do different sources give different numbers — 10% and 12%? You may see 10% quoted for Canada, including elsewhere on this site. Both figures are real; they describe different groups of people. The 10% figure comes from Canadian Cancer Statistics 2025 and covers people diagnosed in 2015–2017. The 12% figure is newer: it covers people diagnosed in 2019–2021 and was published by Statistics Canada in August 2025. Survival is measured on people diagnosed years ago because researchers have to wait to see who is alive five years later — so every survival figure lags behind today's treatments. We lead with the newest figure and date every number on this page so you can see exactly which years each one describes.
Counts for 2026 are projections, not a tally. The 7,500 diagnoses and 6,500 deaths expected in 2026 are estimates modelled from registry data. They are the best available picture of the year ahead, published before the year is complete.
Small provinces come with wide ranges. Where a province sees only a few dozen cases a year, a handful of cases either way moves the percentage a lot. That is why the provincial survival figures below include the margin of uncertainty (the "95% CI" range), and why some provinces show no survival figure at all — the Canadian Cancer Society could not calculate one reliably from so few cases.
How does survival change by stage?
Stage is the single biggest factor in survival. Cancer found while it is still only in the pancreas (localized) has far better outcomes than cancer that has already spread to distant organs (distant or metastatic). Our guide to the stages of pancreatic cancer explains what stages 0 to 4 mean and how staging works.
Canada does not publish survival by stage for pancreatic cancer — the Canadian Cancer Statistics program has not released a Canadian stage-by-stage table. The most widely used stage figures come from the United States, from the American Cancer Society. They are American data, based on people diagnosed in a different health system, and they are labelled that way here:
| Stage group at diagnosis (US) | What it means | Five-year relative survival |
|---|---|---|
| Localized | Cancer is only in the pancreas | 44% |
| Regional | Cancer has spread to nearby tissues or lymph nodes | 15% |
| Distant | Cancer has spread to distant parts of the body | 3% |
United States data: American Cancer Society figures for people diagnosed 2014–2020, as reported by the Canadian Cancer Society. Canada does not publish an equivalent table.
Canadian research tells the same story from a different angle. In SURVMARK-2, an international study of cancer survival that included Canadian data, people in Canada whose pancreatic cancer was found at a localized stage had a one-year net survival of 43.0% (diagnoses 2012–2014) — far above the figure for the disease as a whole. Finding it early changes the picture; the problem, covered below, is that it is rarely found early.
One Canadian province has published its own stage breakdown. In Prince Edward Island, five-year relative survival was 26% for people diagnosed at stages I–II, compared with 3% at stages III–IV (diagnoses 2013–2017, Health PEI, January 2020). PEI's numbers are older and based on very small case counts, but they are Canadian, and they show the same gap.
What are the numbers in my province?
The table below brings together the Canadian Cancer Society's projected cases and deaths for 2026 and its most recent provincial survival figures. The survival column covers people diagnosed in 2015–2017 — it is the newest provincial survival breakdown the Canadian Cancer Society publishes — and it excludes Quebec, whose registry data were not submitted for that period.
| Province | Projected new cases, 2026 | Projected deaths, 2026 | Five-year net survival (diagnosed 2015–2017) |
|---|---|---|---|
| British Columbia | 1,200 | 970 | 7% (95% CI 6–8) |
| Alberta | 730 | 590 | 9% (95% CI 8–11) |
| Saskatchewan | 180 | 170 | 9% (95% CI 7–12) |
| Manitoba | 240 | 210 | 11% (95% CI 9–15) |
| Ontario | 2,800 | 2,400 | 12% (95% CI 11–13) |
| Quebec | 1,800 | 1,600 | Not published for this period |
| New Brunswick | 180 | 160 | Not calculable — too few cases |
| Nova Scotia | 210 | 200 | 9% (95% CI 7–12) |
| Prince Edward Island | 25 | 25 | Not calculable — too few cases* |
| Newfoundland and Labrador | 85 | 90 | Not calculable — too few cases |
Source: projected cases and deaths — Canadian Cancer Statistics Advisory Committee, “Projected estimates of cancer in Canada in 2026,” Canadian Medical Association Journal, 2026 (provincial tables via the Canadian Cancer Society); five-year net survival — Canadian Cancer Statistics 2025, Table 3.4. Counts are rounded by the source and may not add exactly to the national totals. The territories are not broken out by cancer type in these tables. Deaths in Newfoundland and Labrador exceed new cases because the two are separate projections, and deaths in a year include people diagnosed in earlier years.
*Prince Edward Island has published its own figure through Health PEI: five-year relative survival of 12% for people diagnosed in 2013–2017 (95% CI 7–20).
Survival is only one part of how care differs across the country. Our report card, Where You Live Matters: How Canada Responds to Pancreatic Cancer, grades each province on diagnosis pathways, biomarker testing, clinical trial access and treatment — the systems behind these numbers.
How many people are diagnosed, and how many die, each year in Canada?
For 2026, the Canadian Cancer Statistics Advisory Committee projects:
| 2026 projections | New diagnoses | Deaths |
|---|---|---|
| All Canadians | 7,500 | 6,500 |
| Men | 3,900 | 3,400 |
| Women | 3,600 | 3,100 |
Source: Canadian Cancer Statistics Advisory Committee, "Projected estimates of cancer in Canada in 2026," Canadian Medical Association Journal, 2026, via the Canadian Cancer Society.
Pancreatic cancer is the 11th most diagnosed cancer in Canada, but the 3rd leading cause of cancer death. That gap — relatively uncommon, disproportionately deadly — is the whole story of this disease in two rankings. Almost as many people die from it each year as are diagnosed.
These projections are updated regularly, and the numbers move. The same series projected 7,100 diagnoses and 6,100 deaths for 2024, and 7,100 diagnoses and 6,300 deaths for 2025; the 2026 projection is higher, at 7,500 and 6,500. Across the long term, the Canadian Cancer Society's trend analysis shows the rate at which pancreatic cancer is being diagnosed holding steady (→), while the rate at which people are dying from it is rising (↑) — one of the few cancers moving in the wrong direction on deaths.
Why is pancreatic cancer usually found late?
More than 60% of pancreatic cancers in Canada are diagnosed at a late stage. Three things combine to cause that:
- The symptoms are vague or absent early on. Tiredness, mild digestive changes, back pain and unexplained weight loss are easy to attribute to other things — by patients and by doctors. Our guide to pancreatic cancer symptoms covers the signs worth raising with a doctor.
- The pancreas sits deep in the body. Behind the stomach, it cannot be felt on a physical exam, and early tumours do not show up without imaging.
- There is no screening test. Unlike breast, colorectal or cervical cancer, there is no routine test offered to the general population that catches pancreatic cancer early.
By the time symptoms force the question, the cancer has usually spread beyond the pancreas — which is why the stage figures above look the way they do, and why late diagnosis, more than any single treatment gap, drives the survival rate.
What can't these numbers tell you?
They are not your prognosis. A survival rate averages thousands of people of different ages, stages, overall health and treatments. Where you fall depends on your stage, your tumour's biology, the treatment available to you, and how you respond to it — none of which a national average can see.
They describe the past, not the present. The newest survival figure on this page is built from people diagnosed in 2019–2021 and treated with the options available then. Treatments, testing and trial access continue to change after the measurement window closes.
Averages hide real differences. Some people live far longer than the average — including people whose cancer responds well to treatment and people diagnosed at an early stage. Others face a faster course. Both are inside the same 12%.
If you have been given a prognosis, the numbers here are background. The conversation that matters is the one with your own care team, about your stage, your test results and your options.
Where can I go next?
- Recently diagnosed? Start with navigating your pancreatic cancer diagnosis — the first decisions, in order.
- Looking at treatment? See the treatment options for pancreatic cancer in Canada, and how second opinions work if you want another team to review your case.
- Supporting someone? The caregivers hub gathers guidance for the people doing the supporting.
- Worried about costs? Financial support explains the programs that can help with travel, medication and lost income, province by province.
What questions do people ask about these numbers?
How long can you live with pancreatic cancer?
It depends mainly on the stage at diagnosis. Across everyone diagnosed in Canada, 12 out of 100 people are alive five years after diagnosis (diagnosed 2019–2021), and one-year net survival across all stages is 31% (diagnosed 2015–2017, Canadian Cancer Statistics 2025). For cancer found while it is still localized, outcomes are much better; for cancer that has already spread, survival is lower than the all-stage average — in the US stage-group data, five-year relative survival for distant-stage disease is 3%. Your care team can talk about what applies in your situation — no national figure can.
What is the life expectancy for someone with pancreatic cancer?
"Life expectancy" figures quoted online are usually the same survival rates on this page restated. The honest summary is: five-year net survival in Canada is 12% on the newest measurement (2019–2021 diagnoses), up from 10% for 2015–2017 diagnoses. Individual timelines vary widely by stage, treatment and response, which is why oncologists talk in ranges for a specific person rather than a single number.
What is the life expectancy for patients with metastatic pancreatic cancer?
Metastatic (stage IV) pancreatic cancer has the hardest numbers on this page: in the US stage-group data, five-year relative survival for distant-stage disease is 3%, well below the 31% one-year net survival Canada records across all stages combined. Treatment can extend life, and some people respond for much longer than the averages suggest. If this is your situation, questions about treatment goals, trials and quality of life are worth raising early with your team — our treatment options guide is a starting point for that conversation.
Why is pancreatic cancer usually diagnosed late?
Because its early symptoms are vague, the pancreas is deep in the body where a tumour cannot be felt, and there is no screening test for the general population. More than 60% of cases in Canada are diagnosed at a late stage as a result (Statistics Canada).
Why do different websites give different survival rates?
Usually because they are measuring different things: different diagnosis years (older groups had fewer treatment options), different countries, or different definitions — net survival, relative survival and observed survival are not interchangeable. On this page every figure carries its years and its source so you can compare like with like. If a site gives a survival rate with no dates and no source, treat it with caution.
Where do these numbers come from?
Every figure on this page is drawn from a published source, and each is dated where it appears. The main sources:
- Canadian Cancer Society — Pancreatic cancer statistics (accessed November 1, 2026), including the 12% five-year net survival figure for 2019–2021 diagnoses and the 2026 projections.
- Canadian Cancer Statistics Advisory Committee, in collaboration with the Canadian Cancer Society, Statistics Canada and the Public Health Agency of Canada — Canadian Cancer Statistics 2025 (Tables 1.5, 2.5, 3.1, 3.4 and 3.5) and its cancer-specific statistics summary: provincial survival; trend directions; the 10% figure for 2015–2017 diagnoses.
- Canadian Cancer Statistics Advisory Committee — "Projected estimates of cancer in Canada in 2026," Canadian Medical Association Journal, 2026: the 7,500 diagnoses and 6,500 deaths projected for 2026, nationally and by province.
- Statistics Canada — survival estimates for 2019–2021 diagnoses (published August 2025) and the finding that more than 60% of cases are diagnosed at a late stage.
- American Cancer Society stage-group survival (via the Canadian Cancer Society) — used only for the stage table, because Canada publishes no equivalent; labelled as US data where it appears.
- SURVMARK-2 (International Cancer Benchmarking Partnership) — localized-stage one-year net survival of 43.0% for Canada, diagnoses 2012–2014.
- Health PEI — Cancer Trends in Prince Edward Island reporting (January 2020): PEI survival overall and by stage group, diagnoses 2013–2017.
Method, in brief: where two current sources gave different figures for the same measure, we used the one based on the most recent diagnosis years as the lead figure and showed the other openly, with its years, rather than choosing silently. Projections are labelled as projections. Figures from outside Canada are labelled with their country. This page will be refreshed when the next Canadian Cancer Statistics release and Statistics Canada survival update are published.
Pending medical review.